Reading an old-style gas meter - with a mouse chip!
June 2015
"Awesome project!" -- Bryan Cockfield, Hackaday
"Wow that's impressive" -- Trystan Lea, OpenEnergyMonitor
"Have you finished painting that door yet?" -- Maggie
I've been able to read my electricity generation and import meters for some years. But up until now I've not been able to read my gas meter.
The meter is quite old. A Parkinson Cowen / Thorn EMI meter. It says 1985 on the front, which I guess is the manufacture date. It has several numeric digits and a single dial. This is marked '0.071 ft3 per revolution'.

Other designs of meter have options for interfacing. These include a silvered numeral on one of the digits, whose reflectivity can be detected, a magnet embedded in the rotating digit, also here. I've seen water meters that have a soft iron 'target'. You can even use a laser to count rotations of the dial. But my meter has no support for these methods.
I also wanted the highest resolution data I could get. Integer rotations of the dial, such as those measured by the laser technique above, can take a while to occur. I wanted to be able to measure smaller amounts than that. Measuring the angle of the dial seemed the way to go. I've done a bit of image processing before, but didn't want to go down the webcam route. I wanted an Arduino to do all the image processing, so it has to be really simple.
A few years back I read a number of articles about using an optical mouse chip as a low resolution camera. here, here and here. This struck me as an interesting idea but without a good application, although people have been using them to stabilise drones.
I also came across a nice design for a meter reader which used a laser cut faceplate. I've been playing around with laser cutters recently, so thought I'd stick all of the above together and make an optical mouse camera gas meter reader.
Enclosure
First I worked on the case. This consists of a surround, fitting the meter's face, a couple of corner supports and a plate to hold the electronics. It is designed to be easily removable. The power companies don't like things attached to their meters. The python code to generate the design is on GitHub:gas_meter.py.
I wrote a python script to extract the drill and cut positions from the PCB Gerber file. This ensures that the plate and mounting holes all line up so that the camera is directly over the dial.
The generation code is parametric, so it should be possible to adapt it to a different design of meter - assuming that it has a dial.
Here is the DXF output. The mounting plate and the corner pieces just fit within the surround. It is cut from 3mm Acrylic sheet.

Many thanks to FabLab Plymouth for use of their cutter and for all their support.
Electronics
The optical mouse has a small low resolution camera, focused on a surface, designed to measure movement. A test mode allows pixel data to be grabbed, which means that you can stream video from one. There are a number of optical chips that allow camera functionality, including a number of Avago chips.
I found a supplier for the ADNS2610 on e-bay and ordered 5 for $18.50. The datasheet is here.
I decided to use an Arduino Nano as the processor and to mount it on a board holding the mouse chip. The Nano board provides the USB serial interface, as well as the processor. I paid £3.20 for a Nano from China. The ADNS2610 also needs a 24Mhz resonator (£2.25 for 5) and a couple of passives.
The gas meter has a red dial on a white background. To make this stand out I decided to use green LEDs. The red pointer absorbs the green light and looks dark against a bright background. So I added 4 x 5mm green LEDs in a ring around the camera chip, to provide illumination. More on this later.

Then I waited for the parts to arrive. China is so far away. Then at last I could build a prototype. One of the problems with the mouse chip is that it is not a 0.1 inch pitch device. That makes it difficult to fit to prototyping board. The 'one leg in, one leg out' approach I tried here is not recommended. Making a PCB solves this problem.
Note :- C1 = 100nF, C2 = 4.7uF, C3 = 2.2uF, R1..4 = 100R.
First, the good news. I wired up the ADNS2610 chip, ran the code and everything worked. I could see live images coming from the chip. Blurry, just a fuzz of light really. But a definite Fox Talbot moment. Actually, his photos were very much better quality than what I was seeing.
I built a separate board to hold the illumination LEDs. This fits under the main board and has an aperture for the camera to see through. Just for development. I intended to integrate the two at the PCB stage.

The prototype showed up several problems. Firstly, the LEDs were really dim. They were also too directional. I need to get much brighter LEDs, with a wider viewing angle. And I might need a diffuser too.
The frame grabber is also getting bad frames occasionally. I suspect that it is a software problem. I need to investigate this, but for now I just flash the LED on the Nano and discard the frame.
Optics
The biggest issue was the fact that I had no way of making a lens. In mice the lens is provided as a complex part that allows the surface to be imaged and provides an illumination path from the LED. I had no way of making such a part and little information on the internal dimensions of the sensor chip. The datasheet does provide a cross section showing the chip and lens. Assuming these to be accurate, I multiplied by the known diameter of the sensor housing and estimated the chip to be approx. 2.8mm across and 2.8mm behind the aperture.
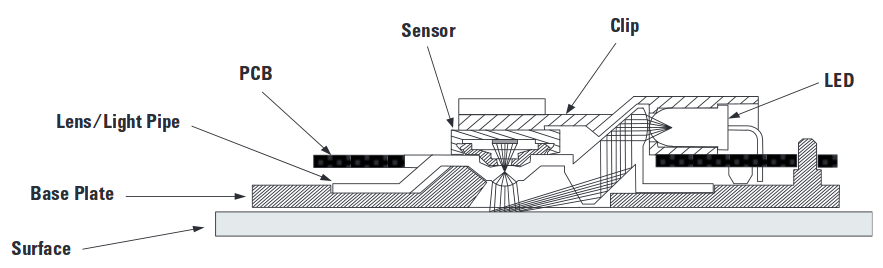
Cross section of mouse optics, from datasheet. (C) Avago Technologies
I looked for some off-the-shelf part that I could use as a lens. I took things apart. I looked around hardware stores for inspiration. But nothing looked anything like a mouse camera lens to me.
Then it came to me. The simplest form of camera is a pinhole camera. You don't need a lens at all. All I needed was to make a hole.
Looking at the dimensions, it didn't look promising. The area I wanted to image was perhaps 15 .. 20mm in diameter. Yet the sensor was 2.8mm behind the aperture on the chip. The dial is around 7mm below the faceplate of the meter. So I would need a pinhole right at the chip body surface and still need to stand the camera off the face.
The chip's aperture was already a small hole, but not good enough to resolve any detail. I tried. So I took a sliver of aluminium foil and made a small hole in it, taking care not to drive the needle into the Cyclops' eye. Here are the before and after photos. It says on wikipedia, the f-number is the distance to the imaging plane divided by the pinhole diameter. Sadly we don't know either of these numbers with any certainty, perhaps 2.8mm and 0.5mm. So, possibly f/5 or f/6 ish. I could use a known diameter pin, but the errors would still be large.


Remarkably this works. I built a test rig to allow me to play with the hardware so far. This stands the board away from where the dial and meter face would be, and provides a simulation of the dial. The illumination board sits under the camera board and the Nano plugs into a socket on the camera board.
The test rig is sat 35mm (h) above the dial, much more than I wanted. Yet the active image area is only about 20mm (w) across the x-axis, slightly less than I wanted (to get the whole dial in). So I'm getting a 32° viewing angle. ie. angle = 2 * atan((w/2)/h). I can't do any better than this with a pinhole camera, as the pinhole is already hard up against the chip body. To get a wider angle I'd need an aperture inside the chip body. Or a lens.
So, given the viewing angle I can now work out the distance the chip needs to be from the dial, which is further than I had hoped. It makes the whole unit a bit bulky. A lens would allow a wider viewing angle so would allow me to reduce the distance between the sensor and dial.

But the big problem is illumination. The LEDs I used were very dim. I need much better illumination.
An LED's brightness is quoted in millicandela (mcd). Candela is the SI unit for luminous intensity, which, quaintly, is still measured in candle power. Adverts for LEDs often seem to confuse the units, so you may see 12,000 cd instead of 12,000 mcd. Until researching this project I hadn't realised how much the intensity of LEDs varies. Some ultra-bright LEDs emit 20,000 mcd. Mine seemed to be about 50 mcd.
There is a conflict between LED viewing angle and brightness. Part of the improvement in brightness is gained from making sure all the light is sent in one direction. I needed a compromise. Given the ~30° viewing angle of the camera, this seems a reasonable value for the LEDs. Also, perhaps a diffuser? Perhaps etched or kiss-cut into the Acrylic mounting plate? How do you design a diffuser? Questions, questions ...
But better illumination cures most of the remaining problems. With higher signal levels there is less noise. Strong, even illumination will make it easier to resolve angles. With higher illumination levels the detector code (see later) will be less likely to give inaccurate readings. Higher illumination compensates for the losses of the pinhole lens (the big f-number).
PCB Layout
I used KiCad for the schematic and PCB layout. I've not done much PCB layout before, but I found these tools very easy to use. I've added a bash file that takes the Gerber files and zips them up in a format that can be used by SeeedStudio to order PCBs.
The finished board is quite small and neat. It could have been a single sided board. I put the mounting holes under the Nano as I wanted to minimise the width of the board and the Nano will be sitting in a socket above the board. The hole for the camera is the largest drill size that SeeedStudio support.

The KiCad files are on GitHub:optical_mouse.
The Nano is powered by, and connects to a PC using a mini USB lead. I have a small low-powered server sat near the gas meter, so it is easy to read the data from the Nano. No need for a radio link. The board, especially the LEDs, consumes lots of power, so it is not practical to use battery power.
For the record, I generate the above png of the gerber files using gerbv. You can edit the settings in the GUI and save them (see GitHub:mouse.gvp) then generate a png image on the command line :
gerbv -p mouse.gvp -x png -o pcb.png -w 640x640
Software
The ADNS2610 datasheet gives a full description of the protocol and the control registers on the chip. These can be read via a 2-wire connection from the Arduino. I started with a library from Conor Peterson here, itself based on Martijn Thé's work, and adapted it for my hardware. I also made it into a C++ class, which allows you to have multiple cameras connected to the same CPU. It also detects bad frames - typically the EndOfFrame bit is not seen. The main code is at GitHub:ADNS2610.ino, the library here.
Initially I just needed to see the video data, so I wrote a simple OpenCV based application to display the video data, see GitHub:mousecam.py. OpenCV is a very powerful set of image processing libraries. It has good Python support, so it is easy to put together an app. mousecam.py was later extended to prototype the image processing and to allow generation of C code describing the sector filters.
During development the Nano simply dumps frames to the PC, where they are processed. It is much easier prototyping on the PC and I prefer to work in Python if possible.
I did some work on image processing a while ago. It was for equipment used to measure the registration offset during semiconductor manufacture. This gave me a chance to play with some image processing algorithms, an area I've always found fascinating. Processing images is something the human brain is very good at, but we devote large areas of the brain and a high proportion of energy to doing it, so the simplicity is deceptive. Image processing is often a hard problem.
The video stream consists of a series of blurry and low res monochrome images of the dial. The contrast of the red dial is enhanced by using green illumination, but this also reduces the sensitivity of the sensor, which only has a 90% output at green wavelengths (520 .. 525 nm). The brightness is also seriously reduced by using a narrow pinhole aperture instead of a lens. Until I think of a way to make or source a lens, I am stuck with this. The illumination is at least fully controlled.
Here is what the input data looks like on the prototype rig; dark, blurry and fairly incomprehensible :

The program mouse_cam.py has a series of command line arguments allowing configuration.
In order to detect the angle of the hand of the dial, I divide the image up into a series of zones. The zones are defined by the centre, the inner and outer radii and the number of segments. These are specified by the -x, -y, --r1, --r2, and -s arguments. The -D flag enables the segment detection and displays the segment boundaries. Each segment describes a set of pixels which are contained in, or touch that segment. The algorithm is simple; for each segment, sum the pixels in the segment zone and find the average. Do this for every segment. The segment with the lowest score has the dial hand in it - ie. it is darker in that radial region.
After applying the sector detection filter (-D) and an AGC (-a), we get this :
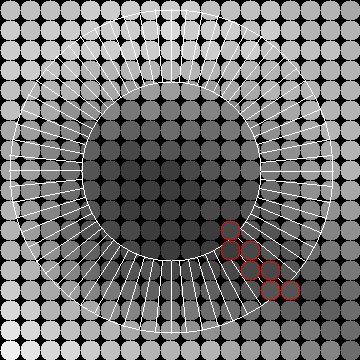
The pixels circled in red indicate the zone with the lowest score. This works remarkably well, even with the terrible, blurry, badly lit images available.
Here is an animation of the simulator, showing all the segments in a filter (with an r2 value > the image size). The superimposed graph shows the average pixel count for each sector. You can clearly see the dip in the sectors in the region of the dial's hand.
The pixel locations for the segments can also be output as C code using the -c switch. For example :
...
// segment 14
const static int seg_14[] = {
    175, 177, 157, 158, 179, 176, 197, 196, 178, -1,
};

// segment 15
const static int seg_15[] = {
    177, 157, 159, 158, 160, 176, 178, 179, 161, -1,
};

// segment 16
const static int seg_16[] = {
    141, 157, 159, 143, 158, 160, 142, 161, -1,
};
...
In this way, once the best zones are determined, they can be compiled into the Arduino code and the Arduino can calculate the dial angle directly.
The table is generated by :
./mouse_cam.py -c [opts] > sectors.c
The analysis code is simple and fast :
static int find_seg(const byte* frame)
{
    float lowest = 256 * 18 * 18;
    int lowest_seg = -1;

    for (int seg = 0; ; seg++) {
        const int* segment = segs[seg];
        if (!segment)
          break;
        int total = 0;
        int count = 0;
        for (; *segment != -1; segment++) {
            const byte pixel = frame[*segment];
            total += pixel;
            count += 1;
        }
        const float average = total / float(count);
        if (average < lowest) {
            lowest = average;
            lowest_seg = seg;
        }
    }
    return lowest_seg;
}
This calculates the segment id for a frame. The main loop has two modes; video stream and detector. The serial stream can be read by code on the host end of the USB cable. The angles are referenced from 3 o'clock and increment anti-clockwise, in 'standard position'.
The Atmel AVR chips have a Harvard architecture, rather than the more typical Von Neumann architecture. They also have very little static RAM. Non-zero initialised variables are normally copied into RAM at program start, by the cstart code, so occupy space in both program and data memory. I found that large segment tables resulted in random crashes. This was due to a shortage of static RAM for the run time code. Therefore I moved the segment tables into code space. This saves on the duplicate RAM usage, but requires the use of macros in 'avr/pgmspace.h' to access the data, see here. For clarity I've left this out of the code example above.
I was going to call the project Polyphemus as I'd stabbed it in its one eye and it ends in 'mus', Latin for 'mouse'. But that would be a hybrid word so I didn't and Polyphemouse didn't scan as well. So it is just plain old 'gasmeter'.
Another wait, for the PCBs, flat-topped green high intensity LEDs and access to a laser cutter. After 3 more weeks I was finally able to fit all the parts to a real meter. Some more problems revealed themselves. The first fitting looked like this :

Firstly, the LEDs reflect in the plastic cover of the meter. I should have realised this would happen. My test rig didn't have a cover. Secondly, the illumination is still too uneven.
Uneven illumination is a common issue in image processing. One way of dealing with it is to take an average illumination level and subtract it from the current image. This should remove any DC offsets caused by poor light distribution. You need to add a uniform DC offset back or the image will have some negative levels.
This approach will have problems if the illumination level or the incident light vary. This can occur if the brightness of the LEDs vary over time - which they will, or the supply voltage varies - it should be regulated. The incident light should be low in its current home, with the LED light dominating. You could build an enclosure round the unit to mask out incident light if it was a problem.
I added a facility to mouse_cam.py to save a series of images, then to read them in and produce an average image. The average frame can be output as a C array. You need to record a short clip of the meter as it goes round once. The first few frames can be corrupted, due to the AGC on the chip and initial timing, so I discard the first 10 frames. The commands to do this are :
# save a sequence of images to /tmp/
./mouse_cam.py -v -S
# delete the first 10 images in the sequence
rm /tmp/mouse_image_000*
# create an average frame image
./mouse_cam.py -v -M /tmp/ -c > ref_image.c
If you want you can turn the sequence into an animated gif to check you are looking at the right thing. I use ImageMagick for this :
convert -delay 20 -loop 0 /tmp/mouse_image_* out.gif
The Arduino code is recompiled with the reference image. This can be subtracted at run time from the current frame.
You can rehearse this by loading the average frame into mouse_cam.py. Run -M without the -c option to create av.png, then run with the -A av.png option to subtract the average frame. View the video stream with the offset applied by the Arduino using the -b option.
This works well, but isn't enough to cope with the glare from the reflections of the illumination LEDs on the meter cover. The contrast of the dial hand is also very poor.
The PCB I waited so long for is no longer suitable. I'm not going to do another iteration because I only need one unit and I don't want to wait another month for the boards.
So I built a second board and mounted it near the face of the meter, with the LEDs pointing at an angle. The two boards are connected by a ribbon cable. A redesign would make this interconnection cleaner and I'd probably move the resistors to the LED board, to reduce the interconnections.

This is what the meter looks like with the whole assembly mounted. The LEDs are so bright, my stair cupboard looks like a prison break.

The last problem is mechanical. The mounting frame is not ideal and provides no protection to the electronics. It is all exposed. I really need to design a full enclosure.
Results
So here is the result. A short video of the raw data coming from the sensor. You can still see some glare from the LEDs, but the rotation of the dial can be clearly seen. This video sequence was used to create an average image to allow the Arduino to correct for uneven illumination.
The output of the sensor, corrected for uneven illumination on the Arduino, then enhanced using simple gain correction in Python, viewed using mouse_cam.py and converted to an mp4 file.
The Arduino can grab images, compensate for uneven illumination, calculate the sector the dial is in and output this as an integer value every frame. This can be converted into usage (in cubic feet or metres). The data can be fed into my home automation system, logged and fed into the MQTT bus.
Conclusion
That's it. Video grabbing and image processing on an Arduino, using a mouse chip to read a mechanical gas meter.
The prototype shows that it is possible to perform rudimentary image grabbing and processing using a very primitive CPU. The technique could be used with a different CPU, perhaps an ESP8266, which would allow the data to be transmitted across a WiFi connection.
It is not suitable for a battery powered system, as it is power hungry. The power requirement makes it difficult to use in many typical installations.
The setup is much more complex than I would have liked. The image quality from the mouse chip is poor. I'm not sure this really is the best approach. I can compensate for the image problems, but this is painstaking and requires a unique calibration for every unit. This would not be acceptible for a mass produced product.
A lens would fix a number of the issues. It would give brighter images. It would allow the chip to be mounted much closer to the meter face, possibly also removing the problems with LED reflections and removing the need for a second LED board. I still don't have a good solution to the lens problem. A manufacturer would be able to design and source a cheap lens, but I don't have the resources to do this.
I need to monitor the LED brightness over time. Any changes will alter the accuracy of the uneven illumination compensation. Major drift in the LED output would require periodic recalibration.
The enclosure needs to protect the electronics and preferably mask out any incident light. An injection moulded box would be more appropriate for a production version. Again, a manufacturer would have the resources to do this.
I've been impressed with the ease of design of PCBs using KiCad. SeeedStudio did a great job of manufacturing the boards. In future I'll be much more likely to produce designs on PCB. The biggest problem is the turn-around time.
The sector filtering seems to be very robust. It is a technique I invented myself and I'm very pleased with it. It should have application in similar 'radial' detection problems.
And it works, so now, finally, I can read my gas meter.
The dial angle is very sensitive. Just running a hot tap for a minute is enough to get a whole rotation of the dial. This is much better than the hourly data a commercial smart meter would offer me.
A digression on Arduino Nanos and udev rules
I've made a few things using cheap Nano boards and I've had some problems. One was just DOA. The cheap ones tend to use a CH340 serial interface chip instead of the more expensive FTDI chips. The first problem I had was with my Chrubuntu laptop. It didn't have the ch341 drivers installed. The security in the chrome BIOS makes it difficult to install Linux drivers. I couldn't figure out how to get it all working. But most Linux machines work fine.
Except they don't. The serial chips seem to be really flaky. I've ended up running the baud rate all the way down to 9600 in order to get them to program properly. Which is terrible. 9600 baud is painfully slow. Especially if you are trying to stream video.
The other problem is that I normally use udev rules to create named /dev/ devices. I have lots of devices attached to my main server and udev automates the association of device with control software. But the CH340 doesn't seem to allow this. The devices don't have a unique id. Which means that if you have more than one cheap Nano device attached to a machine, you can't tell which one is on which /dev port. The trick you can use is to run a program that parses the USB path (by-path) and filters on a specific USB port location. Then make sure that the device is plugged into a specific USB socket. For example /etc/udev/rules.d/99-usb-serial.rules :
SUBSYSTEM=="tty", ATTRS{idVendor}=="1a86", ATTRS{idProduct}=="7523",
    PROGRAM="/sbin/on_nano.py %p", RESULT=="nano_9-1_1", SYMLINK+="barometer"
SUBSYSTEM=="tty", ATTRS{idVendor}=="1a86", ATTRS{idProduct}=="7523",
    PROGRAM="/sbin/on_nano.py %p", RESULT=="nano_9-1_2", SYMLINK+="gasmeter"
The program onnano.py is passed the device path, %p, and extracts a suitable unique name describing the USB device tree. eg. nano9-1_2. The rule creates a symlink /dev/gasmeter for the matching device. To ensure the device is on the right socket I have a 4-port USB hub with labels written on, each one with a nano assigned to it. I also have a general udev rule so you can see which devices are present with *ls -l /dev/nano* * :
SUBSYSTEM=="tty", ATTRS{idVendor}=="1a86", ATTRS{idProduct}=="7523",
    PROGRAM+="/sbin/on_nano.py %p", SYMLINK+="%c"
At just £3.20 each, the price is compelling. Never look a gift horse in the mouth, as they say. Unless it is a Trojan Horse of course.
Postscript: Smart Meters
Like the pods in Invasion of the Body Snatchers, smart meters are finding their way into our homes. I personaly think it is a con. It is just a scam to get the public to pay for the energy companies to lay off their metering staff. The UK Government almost never does anything for the benefit of the public. Forcing everyone in the country to spend hundreds of pounds on a new meter, at a time when we have record fuel poverty has to be a bad and expensive idea. There are also serious privacy implications and some terrible security. We've also seen that some of these meters are massively overcharging people, with errors of 600% in some cases. The first generation of meters are so badly designed they won't allow you to switch provider. They revert to being dumb meters. They may all have to be replaced, at huge additional cost to the public. Sounds like a typical Government IT project.
I'm certainly in favour of people being able to understand and control their energy use. That is why I design meter readers. But that isn't their agenda. I have been offered a smart meter, but the terms are poor. I can choose what metering period I want to have access to, but the supplier will then have the same access. So if I want hourly data, they have it too. Hourly, or even daily data is a serious privacy breach. But fine grained data is essential for an individual to make informed decisions. I log my electricity usage every second. I consider it my home's heartbeat. But that data is private. If the meter standards were open and the data private, I would have one. But they are not.
As I already meter my own usage I have no need for a smart meter so I've refused to have one. Thankfully they are not yet compulsory.
I am, however, happy for the energy companies to have any solar generation data. This has no privacy risks and is presumably useful for running the network. I've thought for a while that it would be great to see all solar installations' output in real time across the country. You could use this to track individual clouds, treating the solar panels like pixels in a large camera. It would allow you to predict clouds crossing your panels.
![]()