An Arduino based project to read Watt-hour data from an Elster A100C electricity meter.
For years I'd wanted to get solar panels so I could generate my own electricity. At last, in February 2012 I managed to achieve this. I fitted 12 x 240 Watt panels on our roof. We live in the South West of England, the best area in the UK for sunshine. The house is close to the South coast, which also increases the number of clear sky days. The roof faces almost due South and has little shading (the next door house shades the roof a little before 09:15 in the morning).
The generation meter is an Elster A100C. This is a popular electricity meter, used here to monitor the output of the solar inverter. It is more commonly used as a consumption meter.
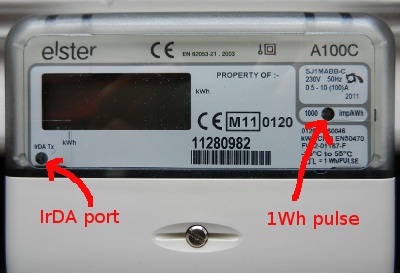
The A100C has an LCD display showing the number of kilowatt hours generated, but it also has two optical outputs. One flashes momentarily each time one watt hour is recorded. The second output is an infrared port which transmits the details of the meter, including accumulated Watt Hours, every second or so.
There are lots of commercial power meter readers around, and many homemade ones too. But they all seem to simply count the 1Wh optical pulses. This does give you an accurate measure of instantaneous power usage / generation, but does not give accumulated totals. If you get a malfunction in the reader you will lose counts. If you count the IrDA output it always gives you accurate accumulated totals. I'm not sure why no-one else seems to read the Wh data, but for commercial units it is probably because each meter has a different standard, which would require more complex code and testing. Some apparently use encryption in the interface. As I only have one meter to read, I don't have this problem.
I should make clear that all I am doing here is reading the meter. The IrDA interface does not have a facility to change the meter in any way. There is no IR data being sent to the meter.
I had some photo diodes in a drawer, so connected one to a 'scope probe and measured the voltage across them, to see what the pulses looked like. The voltage across the photodiode looked like this :
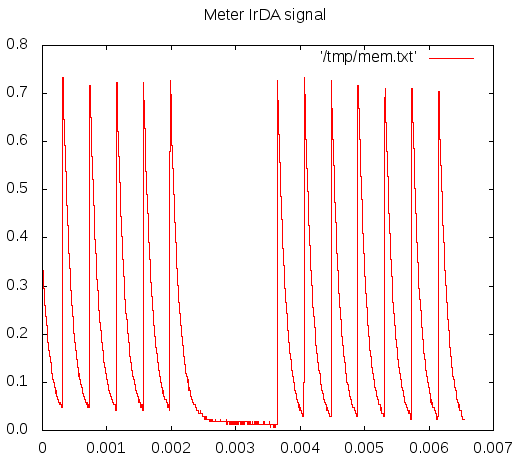
The pulses are about 416µs apart, giving a bit rate of 2400 baud. The 'on' period is around 65µs. The decay is presumably caused by the capacitance of the photodiode discharging. The pulses are in groups of words and seemed to be simple serial data with 1 start and 2 or 3 stop bits.
I came across this article by Richard Gregory who built his own meter reader back in 2009. He reverse engineered the protocol used in the meter. Many thanks to him for the article and his help. He also pointed out that Elster, the manufacturer, publish the serial protocol in a manual, so it is actually well documented. Most manufacturers seem to regard their protocols as company secrets. It is good to see a company being open about their information.
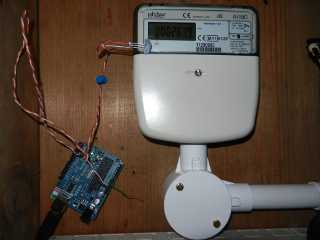
I decided to use an Arduino Duemilanove to decode the data because they are easy to use. I replaced the photodiode with a TSL261R optical sensor, which provides amplification and filtering of visible light, removing the need for a separate amplifier. This 3 pin device can be connected to +5V, 0V and one of the interrupt pins on the Arduino. No other hardware is required.
The photo sensor cost £3.17 from Farnell. An Arduino costs £20.53, although I already had a spare one. I also needed a 5m USB cable which cost £1.15 from Amazon. Total cost £24.85. The Arduino is currently unboxed and the photo sensor is blutacked to the electricity meter. One day I will get round to putting it in a proper box!
I decided not to use pulse stretching hardware to extend the IR pulse, as Richard had done. Instead I use a software only approach. An edge triggered interrupt is generated at the start of each IR pulse. The elapsed time between such pulses is logged to a buffer. The main loop reads this buffer, and reconstructs the binary sequence based on the time between pulses. This binary sequence is then converted into a byte stream, decoded, and the Watt-hour data is sent out via the serial port.
My linux server powers the Arduino over its USB cable. It would be possible to connect via a Bluetooth link, but the Arduino would then need a local power source. As I have a server near the meter it is simpler to use a USB cable. There is a simple Python program running on the server logging data from the Arduino every minute or so. I use a simple textfile based log, with a directory structure [year]/[month]/[day].log each line having the hh:mm:ss and accumulated Wh.
I can then generate graphs showing the usage over time. This is done by another Python script, interfacing to gnuplot which is used to generate the actual graphs. This runs on a web server that I can access over an ssh tunnel from my phone, so I can view the graphs when away from home. An example graph is shown here - a very sunny day in April.
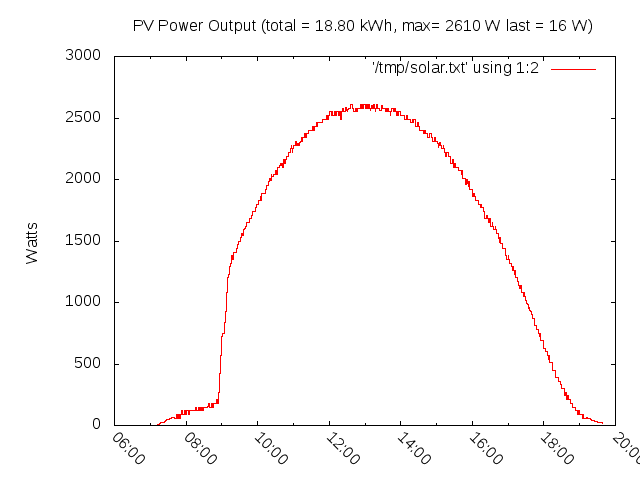
You can see clearly the shading that occurs in the early morning. After around 09:15 the panels get full sunshine for the rest of the day. On this particular day (01-Apr-2012) the panels generated a total of 18.8 kWh. It is currently averaging 11.3 kWh per day. In the Summer the peak of the graph should be higher as the Sun will be closer to normal to the panels.
The solar panels are behaving well. With the feed in tariff in the UK I hope they will pay back in 5 years. Our electricity consumption has dropped by 1/3 and we now generate more than we import. With the graphing you can see at a glance what the panels are doing, even when away from the home.
I've since added a script that pushes this data to cosm. Cosm (which used to be called Pachube) is a service that allows you to push sensor data to a server and then view it in a variety of ways. Part of the "Internet of Things".
You can view my live cosm feed here or you can generate an inline graph :

Their server renders the graph for you and sends it back as an image. Which is great. You can also set triggers, for example it sends me an email if the feed freezes.
Code Library
In order to make this project more useful to others, I've turned the code into a library. This can be included in any Arduino or compatible project by copying the *.cpp and *.h files into a subdirectory of the arduino 'libraries' directory. see here for more details on how to do this.
Library code : elster.cpp elster.h
To use the library simply create an ElsterA100C object and pass it a callback function. This function gets an unsigned long which is the meter reading in Watt hours. It is useful to flash an LED or something here to give a visual indication that the system is working. In this example it simply prints the meter reading to the serial port.
void meter_reading(unsigned long r)
{
  Serial.print(r);
  Serial.print("\r\n");
}

ElsterA100C meter(meter_reading);
You then need to initialise the object in the 'setup()' function, passing it the interrupt number, ie. the interrupt relating to the pin that has the photo sensor connected to it, in my case interrupt 1 (which is digital pin 3 on the Arduino).
void setup()
{
  meter.init(1);
  ...
}
In your main loop you need to call the decode bit stream function which gets a string of bytes from the interrupt handler. These are passed to the 'on_data()' function. This will result in your callback function being called with the meter reading. It is also useful to add an LED flash or some other diagnostic here.
void loop()
{
  // Decode the meter stream
  const int byte_data = meter.decode_bit_stream();
  if (byte_data != -1) {
    meter.on_data(byte_data);
  }

  ..
}
And that's it. All you need to do is provide a callback and it will be fed with data from the meter every second or so.
Postscript :
Thanks to Tim Small who contacted me in 2015 to say that he'd been working on reading the A1100 meter. He pointed out
'Although similar in many ways, the IR pulse width is a lot shorter at 5 microseconds meaning the TSL261R you used for the 65 microsecond pulse-width A100c is not suitable.'
He provided these links :
Thanks also to Pedro Riveros who contacted me to say that he's successfully reading an elster A1100 based on my work.
His github is here: https://github.com/priveros/Elster_A1100
see also
- Open Energy Monitor Introduction to pulse counting. See also their blog post on my design here and here and their hardware kits for this project (thanks guys).
- Jee Labs Electricity consumption meter
- gridinsight Monitoring Electricity Usage (with some useful links)
- Explanation of how kilowatt-hour meters work (electromechanical)